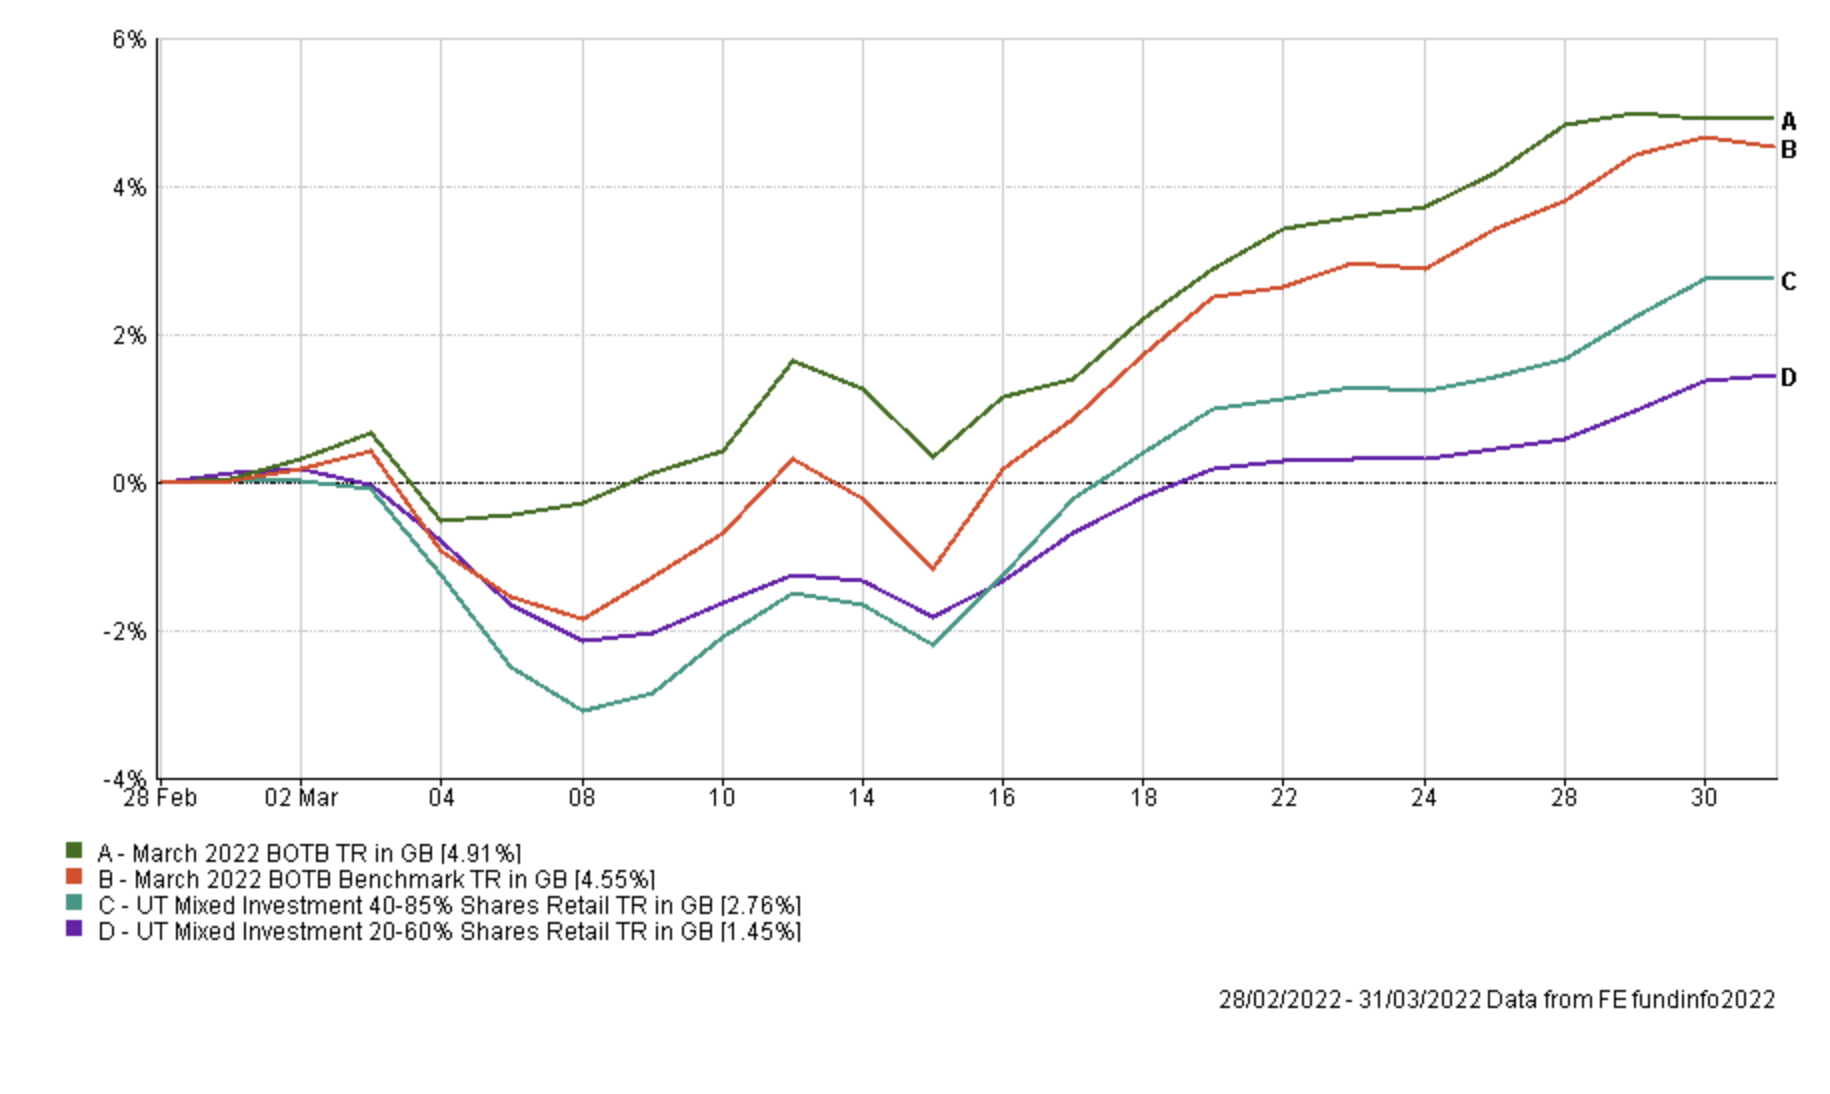
Of the 30 funds in March's BOTB, 20 funds have retained their place in April's selection. The chart below shows the average performance of the BOTB during March (the green line) against a benchmark that is calculated using the respective sector averages for each fund in the BOTB and assuming the same asset mix (the orange line). You can see that the BOTB outperformed its benchmark once again.
The chart also shows how the selection performed versus the average professionally managed fund from the Mixed Investment 20-60% Shares sector and the Mixed Investment 40-85% Shares sector. The former is typically more cautious than the BOTB given its lower equity exposure while the latter tends to be more adventurous. You can see that the BOTB avoided the market falls in early March but also rallied more strongly when markets rebounded.
Full article available exclusively to 80-20 Investor members.
To read the complete article, sign up for a free trial or log in below.
Start a free trial Already have an account? Log in


