
 Nationwide has reported the biggest annual drop in UK house prices since 2009, according to its latest figures for July 2023. It recorded an annual fall of 3.8%, a figure that is calculated by comparing the current month's seasonally adjusted figure with the same month a year earlier. Rising interest rates have contributed to a sharp rise in mortgage costs in recent months, putting further pressure on the housing market with many simply unable to afford the cost of a new house purchase.
Commenting on the figures, Nationwide said that 'Housing affordability remains stretched for those looking to buy a home with a mortgage. For example, a prospective buyer, earning the average wage and looking to buy the typical first-time buyer property with a 20% deposit, would see monthly mortgage payments account for 43% of their take-home pay (assuming a 6% mortgage rate). This challenging affordability picture helps to explain why housing market activity has been subdued in recent months. There were 86,000 completed housing transactions in June, 15% below the levels prevailing the same time last year and around 10% below pre-pandemic levels'.
Nationwide House Price Index - May to July 2023
We've provided a 3 month summary of the Nationwide House Price Index below. For the latest information on UK house prices, including the latest House Price Index figures provided by Halifax and Rightmove, check out our article 'What is happening to UK house prices?'.
| Nationwide House Price Index | Jul 2023 | June 2023 | May 2023 |
|
Monthly change in house prices |
-0.2% | 0.1% | -0.1% |
|
Annual change |
-3.8% | -3.5% | -3.4% |
|
Average price |
£260,828 | £262,239 | £260,736 |
Historic annual change in house prices - 2007 to 2023
The image below provides a summary of the changes in the annual house price data since 2007 for both Nationwide and Halifax.
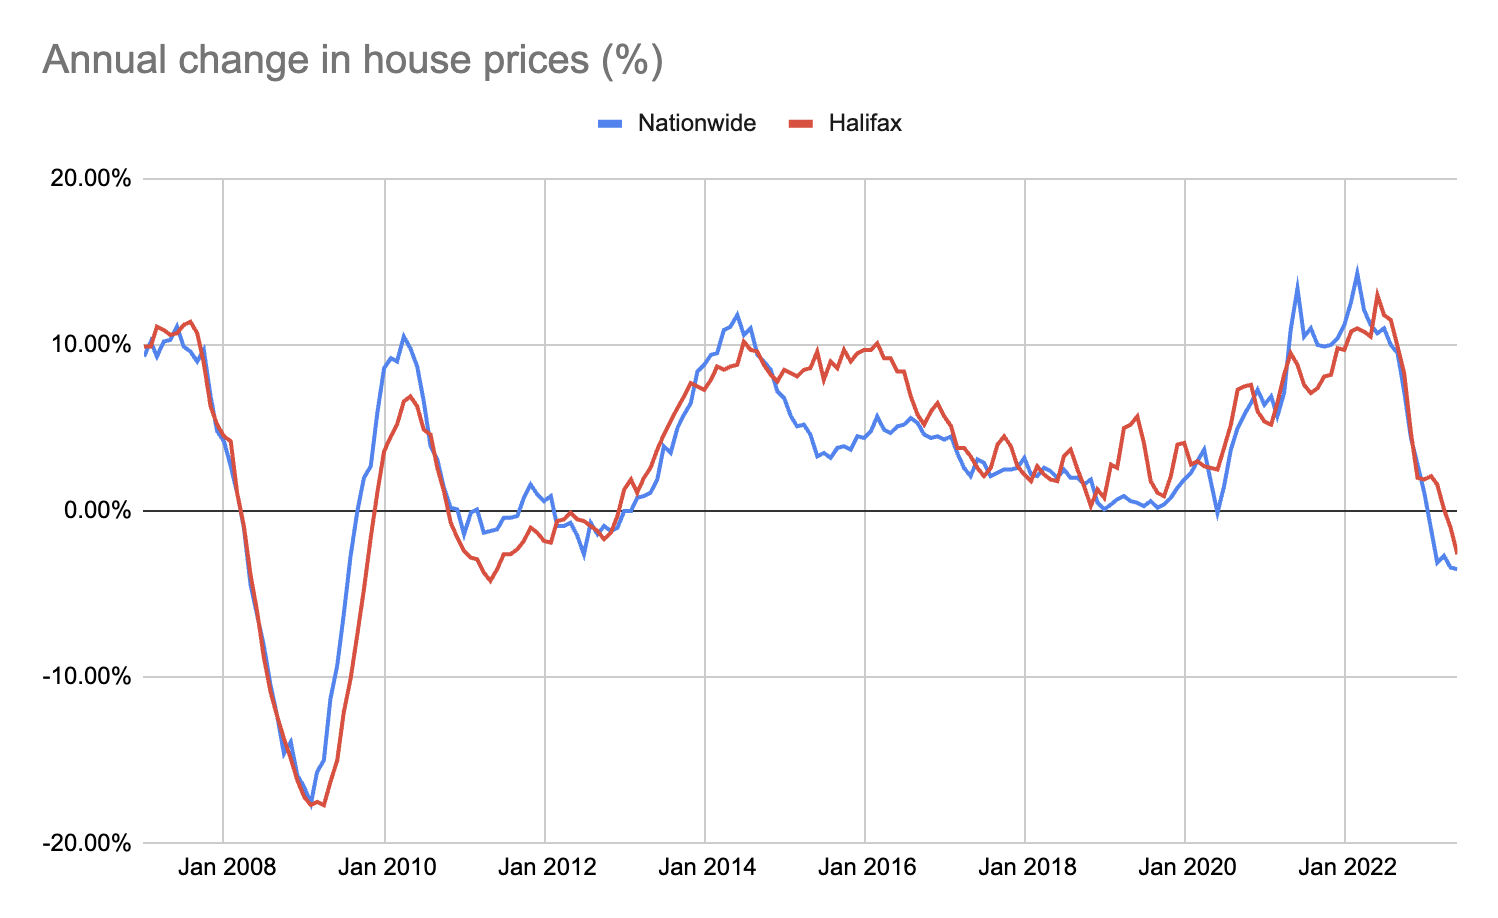
Data sources: Halifax, Nationwide (Updated 01/08/23)
Where next for house prices?
A number of industry experts are predicting that house prices could fall around 10% by 2024. The Office for Budget Responsibility (OBR) published a property forecast in March 2023 that predicted house prices were likely to fall 10% in 2024 when compared to their high in the fourth quarter of 2022. It reasoned that 'Low consumer confidence, the squeeze on real incomes, and mortgage rate rises' were likely to contribute to further falls in UK house prices. For the latest insight and analysis on what is happening to UK house prices, check out our regularly updated article 'What is going to happen to UK house prices?'.
The UK House Price Index, sourced from HM Land Registry and other government sources, is the most accurate of the various house price indices because it is calculated based on completed sales (including cash sales and properties purchased with a mortgage). It is able to provide a clearer picture of what is happening in the UK housing market, however, there is a noticeable lag in the data.
The latest figures as of 1st August 2023 provide data up to May 2023. It shows average completed sales have been steadily falling in recent months, with the annual change in house prices up only 1.7% in May, compared to 4.1% in March. The following table shows the data from the UK House Price Index from March to May 2023.
UK House Price Index - March to May 2023
| UK House Price Index | May 2023 | April 2023 | March 2023 |
|
Monthly change |
-0.4% | 0.5% | -1.2% |
|
Annual change |
1.7% | 3.5% | 4.1% |
|
Average house price |
£285,861 | £286,489 | £285,009 |


 MTTM AI (beta)