
Welcome to the latest episode of my monthly YouTube show where I discuss what is happening in investment markets and what to look out for. Today I explain how and why markets have changed so much in a month.
Each show lasts between 5-10 minutes and is aimed at DIY investors (including novices) seeking contemporary analysis to help them understand how investment markets work.
Subscribe to my YouTube channel to receive my weekly analysis of investment markets or alternatively, you can listen via my weekly Midweek Markets podcast below.
Damien's Market Updates monthly podcast
Other ways to watch, listen and subscribe
You can listen to other episodes and subscribe to the show by searching 'Money to the Masses' on Spotify or by using the following links:
Abridged transcript - Damien's Market Update - September 2022
What a difference a month makes. At the start of August the market’s expectation of where interest rate would be in the future were tumbling, particularly in the US. This was positive for US tech stocks and bonds in particular. But of course, such is the power of the Fed that similar positive market moves were seen globally in stocks and bonds. The strength of the rally at the time raised the question of whether we were witnessing the formation of a new bull market in equities, or whether it was just another bear market rally - or a so-called failed breakout.
As it turns out, it was the latter. The comparisons I drew with similar stock market rallies during the dotcom bust and the financial crisis, that ultimately fizzled out, turned out to be pretty accurate. Will we now see stock markets roll over to set new bear market lows? We will have to see but it is something I will come back to later in this video.
During the first half of August the buy the dip mentality was evident in equity markets, something we hadn’t seen in the first half of 2022. Those of you who subscribe to my 80-20 Investor service know that I have been highlighting the usefulness of technical analysis in the current environment in order to make sense of the noise and ever changing market narratives which have mostly centerd on second guessing global central bank policy decisions.
If we focus the US stock market and the S&P 500, at the start of August the index sat at 4150. In my newsletters I had been stressing the importance of the 4300 and 4500 levels in determining the future direction of the summer rally. Given that the market euphoria at the time was built upon a narrative that the US Federal Reserve would no longer be compelled to hike interest rates aggressively as inflation had peaked, I cautioned that it left the rally vulnerable if these assumptions were challenged.
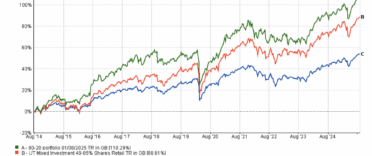
Sometimes technical analysis can work beautifully, other times it is less reliable. During August it was a great example of where it worked beautifully. The S&P 500 rally failed precisely to the 4300 level, which also pretty much coincided with the 200 day moving average at the time. I have drawn a simple technical analysis chart using Yahoo which is free to use, which shows the movements of the S&P 500 over the last year, as well as the key lines of support and resistance, as well as that 200 day moving average.
You can see that right on cue, at the 4300 level that the S&P 500 rally collapsed and the market eventually broke down below the 4000 level, and ultimately the 3900 level (where we are now). It means that bearish investors are back in control and that “buy the dip” mentality has turned into “sell the rip”. You can also see that the collapse has confirmed that we remain in a downtrend dating back to late 2021, that I warned about in my last video. That’s despite the S&P 500 breaking out of the shorter-term downtrend that dated back to the earlier 2022.
Unless the bulls start buying soon, the S&P 500 is in danger of revisting the lows of June, and the possbility of new 2022 lows being achieved remains on the cards. As an aside, the S&P 500 has closed below its 200 day moving average for more than 100 trading days, which is the longest streak since the financial crisis. That is pretty bearish in itself.
The catalyst for the market slump at the August was the Jackson Hole Symposiumwhen Federal Reserve Chair, Jerome Powell, gave a hawkish assessment of the future path of the central bank’s monetary policy. This challenged the market's dovish-pivot narrative that had driven the rally in equity markets through July and August, and things quickly unravelled as a result.
It meant that US stocks endured their weakest August performance since 2015. The weakness in US equities was reflected globally. For example, the German DAX fell by 3.37%, the FTSE 100 fell by -1.88% while the MSCI ACWI fell by 3.13% during August. The real bright spot was the Japanese Nikkei 225 which rose over 1% for the month of August. Buoyed by the yen hitting new multi-decade low against the US dollar, which is a boon for Japanese exporters.
But August wasn’t just a bad month for equity markets, bond funds also tumbled as bond yields burst higher as markets began pricing in more hawkish policy decisions from central banks. UK corporate bond funds had their worst month in 4 years. UK gilts also had a dire month as concerns grew about the scale of government borrowing required to cope with the cost of living crisis.
With both bond and equity markets falling in tandem during August it was reminiscent of the first half of 2022. The typical 60% equity / 40% bond portfolio struggled through its lack of diversification, falling by around 1.75% during August.
In conotrast, my own £50k portfolio which is diversified beyond just bond and equities, produced a positive return during what was a tricky month for markets. thanks to its low bond exposure and the inclusion of commodities and energy stocks. The weakening pound also provided a positive contribution to parts of my portfolio. In fact the poud fell more than 4.5% against the dollar during August, the worst monthly performance since the Brexit referendum in 2016, in a further harsh assessment of the UK’s economic prospects in the coming months. The pound is at 37 year low against the US dollar. A rebound in commodity prices, also proved positive for my portfolio as did my cash holding.
We are now a week into September, a month that is historically the weakest month of the year for stock market returns. We have already started the month on the back foot with bonds and equities continuing to fall. The FTSE 100 sits at 7232, stuck in the trading back of 7100 and 7300. If it can break then the market is likely to go looking for 7500 falirly quickly. Below, keep an eye on the support levels of 7150 and then 7000 if the market continues to fall.
Pressure remains on bond markets with yields on both UK gilts and US treasuries soaring in recent weeks. The 10 year us treasury yield now back at 3.3% wile the 10 year UK gilt yield is back above 3% as investors worry about the pace and ultimate level of central bank hikes and borrowing. Inflation remains above 10% in the UK and some forecasters are suggest we could see this rise to 18% in the future. But with the UK and Europe set announce plans to cap energy prices there will be some respite from consumers.
Although it is estimated that possible energy price cap plans in the UK may reduce inflation by 4% it means that inflation will still be a long way above target. In that scenario the Bank of England will still need to be aggressive with its rate hikes if it is to tackle persistently high inflation. And history suggests that central banks have a tendency to hike interest rates until they break something - be it investment markets and/or the economy. Things could therefore get a lot worse before they get better.


 MTTM AI (beta)