
 The total amount of rent paid by tenants across the UK has fallen 8% over the past 3 years, taking average rent back to levels last seen in 2015, according to research by estate agents Hamptons.
What did the research find?
Those born between 1980-1996 left home in the middle of a global financial crisis and, struggling to get onto the property ladder, ended up caught in a cycle of rent. In fact, it’s estimated that millennials have collectively paid more rent than any other generation in history.
Their contributions hit a peak in 2017, when millennials paid £33.3bn, equating to 55% of total rental payments across the country. However, with the oldest reaching 40 years of age, the millennial generation are increasingly likely to be homeowners as opposed to renters.
What is happening now?
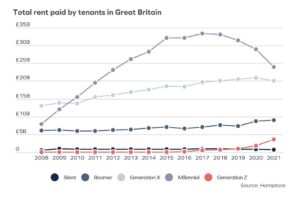
As of 2021, millennials are paying £24bn in rent, falling a whopping 28% from the 2017 peak and now accounting for a much lower 42% of all UK rental payments.
With fewer millennials in the rental market, the overall amount of rent being paid is also starting to fall, down 8% from a peak of £62.4bn in 2018 to £57.3bn in 2021. The newest figures take the amount of rent paid by UK tenants back below 2015 levels.
The graph below demonstrates how each generational groups’s rental payments have changed in recent years:
What is happening to younger renters?
On average 16 years younger than millennials, Generation Z’s (1997-2012) total rental payments doubled from £1.8bn to £3.6bn between 2020 and 2021, and analysts expect their contribution to double once again next year.
However, after the pandemic sent both house prices and rent soaring, more and more of the younger generation could be choosing to stay at home until moving out becomes more affordable.
This would keep millennials responsible for the lion's share of total UK rental payments for the foreseeable future, even as many breach the gap between renting and homeowning.
The data below demonstrates how UK rental payments are split between the different generational groups:
| Generation | Total rent paid in 2021 | Annual change in rent paid | Share of rent paid |
| Silent (1928-1945) | £0.7bn | -22% | 1% |
| Boomer (1946-1964) | £9.0bn | 3% | 16% |
| Generation X (1965-1979) | £20.1bn | -3% | 35% |
| Millennial (1980-1996) | £24.0bn | -17% | 42% |
| Generation Z (1997-2012) | £3.6bn | 102% | 6% |
(Data courtesy of Hamptons)
Regional rent divide
Rents across the UK are continuing to rise - the average rent of a new let rose 7.4%, or £75 in August, compared to the same month in 2020 to reach £1,085 per month - but the regional differences are still stark.
Areas near to London continued to see the strongest growth, with rents in the South West rising 13.9%, followed by the South East (12.8%) and the East of England (10.9%).
Uncharacteristically, London saw the weakest growth, with rents up just 1.4% annually. While rents in Outer London only rose 3.9% in August, Inner London rents are still recovering, with the average rent still 8.8% cheaper than in August 2020.
Removing London from the equation, Great Britain saw a 10.60% increase in average rental payments between August 2020 and August 2021.
The table below demonstrates how average monthly rent of a new let property has changed year-on-year in different parts of the country:
| Region | August 2020 | August 2021 | Year-on-Year Change (%) | Year-on-Year Change (£) |
| Greater London | £1,765 | £1,790 | 1.40% | £25 |
| Inner London | £2,322 | £2,117 | -8.80% | -£205 |
| Outer London | £1,662 | £1,727 | 3.90% | £65 |
| South East | £1,075 | £1,213 | 12.80% | £138 |
| South West | £868 | £989 | 13.90% | £121 |
| East of England | £985 | £1,092 | 10.90% | £107 |
| Midlands | £708 | £763 | 7.80% | £55 |
| North | £674 | £738 | 9.50% | £64 |
| Wales | £697 | £749 | 7.50% | £52 |
| Scotland | £678 | £751 | 10.80% | £73 |
| Great Britain | £1,010 | £1,085 | 7.40% | £75 |
| Great Britain (excl. London) | £817 | £904 | 10.60% | £87 |
(Data courtesy of Hamptons)


 MTTM AI (beta)