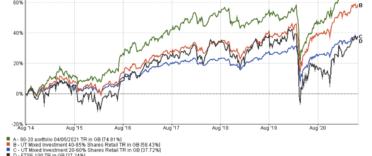
Two years ago I carried out a piece of research looking at how the high, medium or low risk selections from historic Best of the Best Selections would have fared in isolation. Or in other words, how would a notional high, medium or low risk 80 20 Investor portfolio have fared. You can read the original piece of research here.
Recently a number of 80-20 Investor members have asked about looking at how variations of the BOTB would have fared historically so I thought it was time to update this research. As I said previously, the aim is not to suggest that people buy all the funds but simply to give a graphical representation of how the 80 20 Investor algorithm is faring as a whole from a fund picking perspective. It also allows me to then benchmark the performance for users to see. However, 80-20 Investor is not prescriptive or dictatorial.
Full article available exclusively to 80-20 Investor members.
To read the complete article, sign up for a free trial or log in below.
Start a free trial Already have an account? Log in


