
Since the Brexit referendum back in 2016 the pound has tumbled in value, by as much as 18.4% as shown in the chart below (click to enlarge). The chart shows the GBP/USD exchange rate which ranged from $1.47, just ahead of the Brexit referendum on the left-hand side, to $1.20 which we've seen in recent months.

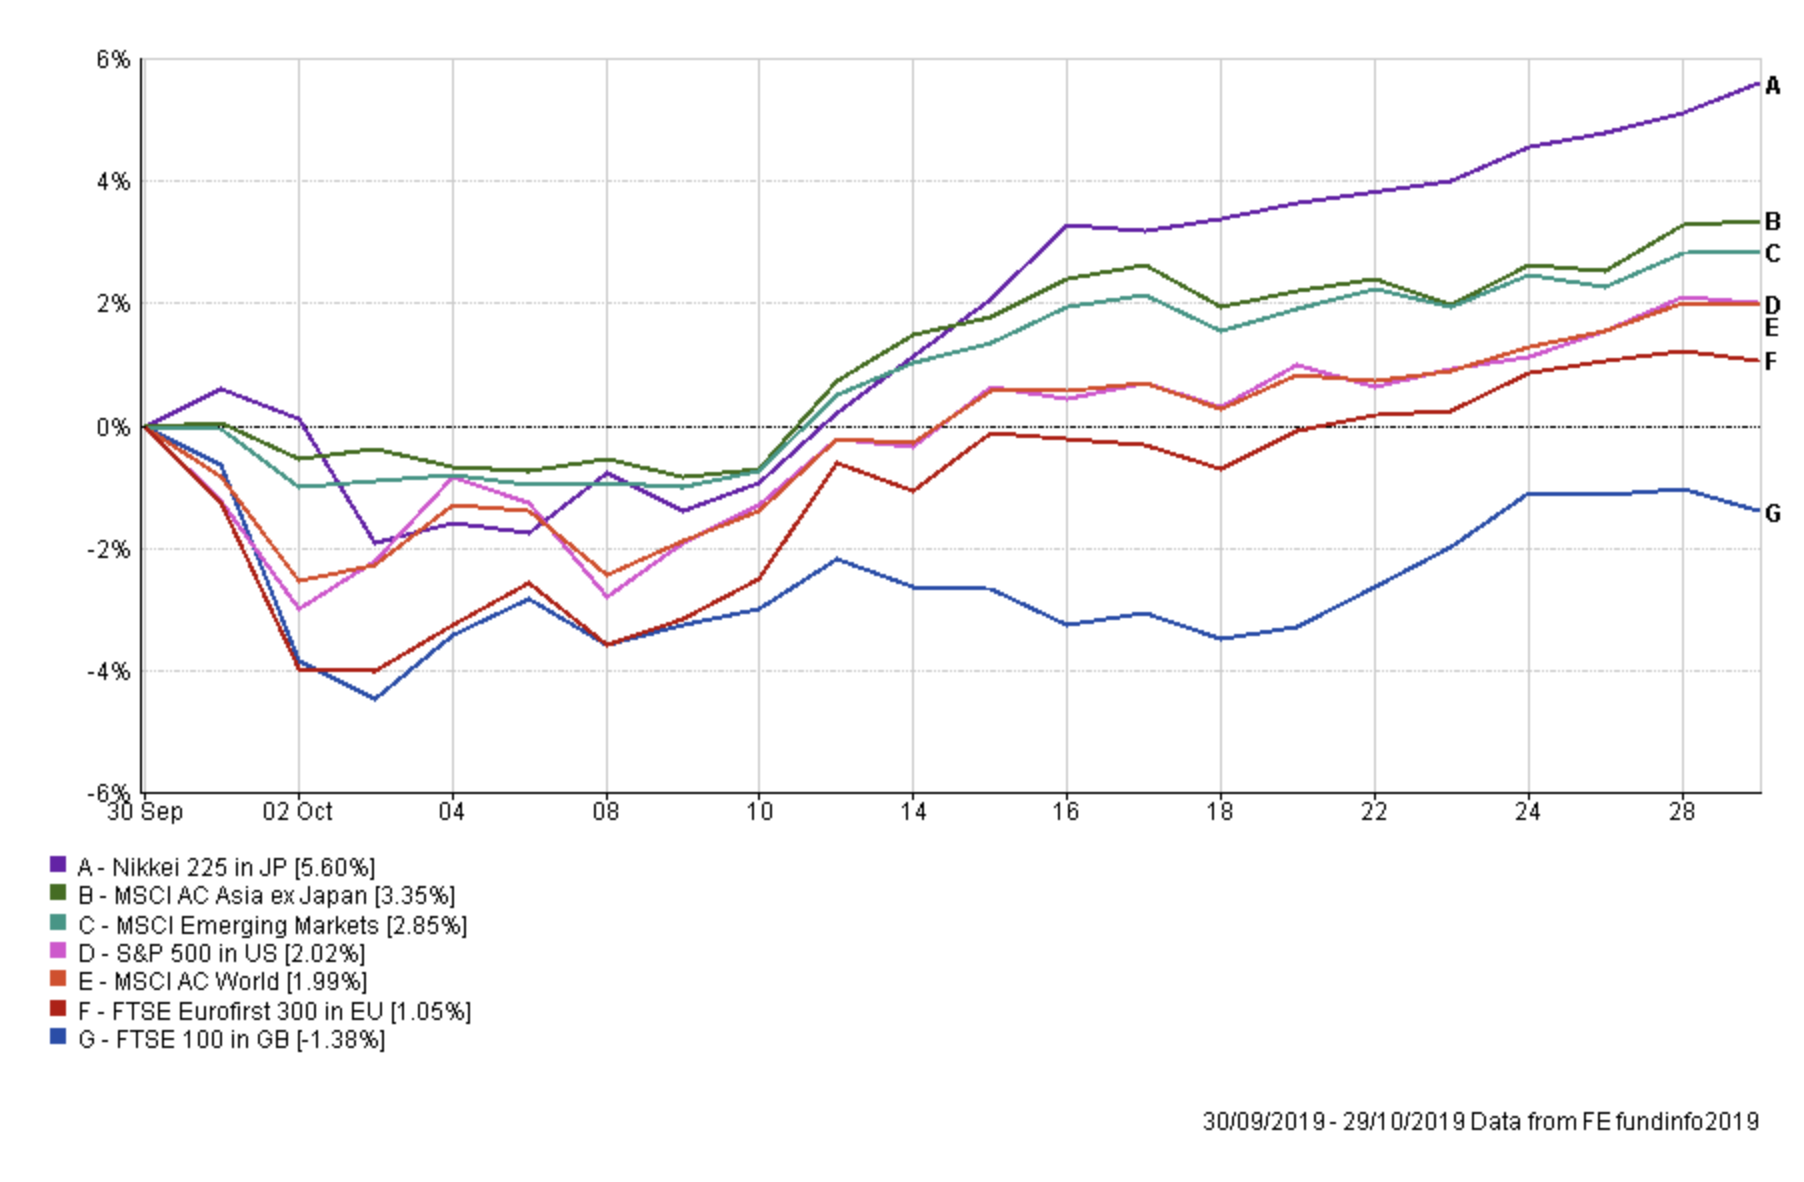
While the pound strengthened into April 2018, generally speaking, UK investors have benefited from the weaker pound over the course of the last three years. But in the course of the last month we've seen the pound strengthen aggressively as Boris Johnson secured a new Brexit deal with the European Union. The first chart below shows the price movements of key stock market indices during October in local currency terms.
The second chart below shows the impact of taking into account the appreciation of the pound.

Full article available exclusively to 80-20 Investor members.
To read the complete article, sign up for a free trial or log in below.
Start a free trial Already have an account? Log in

 MTTM AI (beta)